%20copy%202.png)
How Data Visualizations Can Be Used to Advocate for Digital Equity Initiatives

Vernonburg Group’s Digital Equity Map is a free online tool anyone can use to visualize broadband availability and adoption levels in any region or community in the United States. It can be used to answer a variety of questions important for determining community needs, designing programs, and allocating resources and services:
- Which communities face the greatest gaps in digital inclusion? What areas lack broadband access? Where are there low rates of broadband subscriptions or access to a computer? What are the trends in my county, city, town, or my neighborhood?
- Where should we invest in expanding infrastructure? Which internet service providers are nearby that could strategically and efficiently expand to an unserved or underserved area?
- Where should we invest to increase broadband adoption? Where are the gaps and what kind of gaps are they? There might be one neighborhood that still lacks broadband infrastructure, while another community has broadband available but needs help increasing subscription rates.
- What are the characteristics of communities with low rates of broadband availability or adoption? What correlations do we see between broadband availability and adoption and the presence of different demographic groups? This can help inform what kinds of approaches and partnerships will be important to reach those communities and increase adoption.
- Where can I get data and visualizations to inform and strengthen my digital equity grant application? The National Telecommunications and Information Administration’s Digital Equity Competitive Grant is due towards the end ofg next month (September 23), and I need high-quality data visualizations to strengthen my proposal.
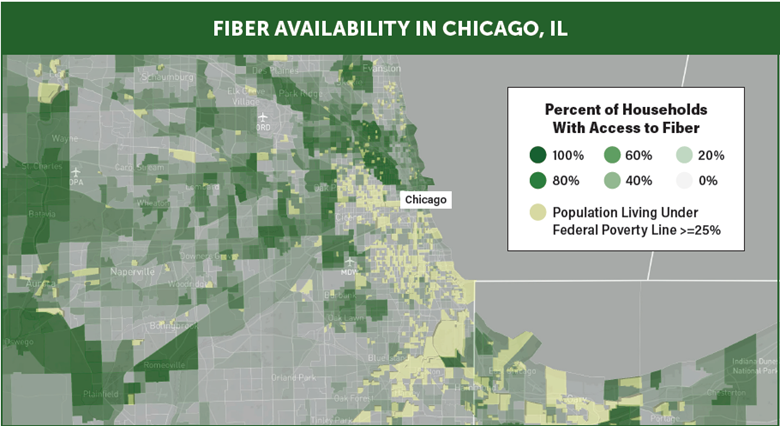
Chicago’s Fiber Availability on the Digital Equity MapThe screenshot to the left, for example, shows how end-to-end fiber connections have not been deployed in neighborhoods in Chicago with higher rates of poverty. In Chicago, these higher poverty neighborhoods are also majority Hispanic or Black. This kind of analysis can be conducted for any community in the US.
If you are a policymaker, program manager, digital navigator, community organization, internet service provider, advocate, or researcher, this tool can help you answer questions like these at your desired level of granularity.
For example, we used the Digital Equity Map while advising the Vermont Community Broadband Board (VCBB) on development of its BEAD Five-Year Action Plan and its Digital Equity Plan. Moreover, several internet service providers (ISPs) have used our Digital Equity Map to identify unserved and underserved locations and to demonstrate the social and economic impact of federal and state broadband deployment grant applications. Community-based groups are using the Digital Equity Map to support existing programs and develop new ones.
Vernonburg Group created this tool because we saw stakeholders struggling to answer these questions, but lacking access to a simple, free broadband data visualization tool. Data were available publicly, but there was no simple, no-cost way to view, manipulate, and present the data in an informative and actionable way. While we have aimed for simplicity, we also realize that this tool can still be a little daunting to use at first. To make it easier, we have a video tutorial available on the Digital Equity Map webpage to walk you through it. We hope this helps demonstrate the different ways you can use the Digital Equity Map to answer questions relevant to your community. With this tool, you can help visualize needs and inform programmatic interventions in your community.
Vernonburg Group proudly offers individualized services to analyze your community’s greatest needs. We offer customized maps, more granular statistics, and assistance with state or federal broadband grants. Please visit our Digital Equity Map and scroll down to the form to get in contact with us. We look forward to working with you.